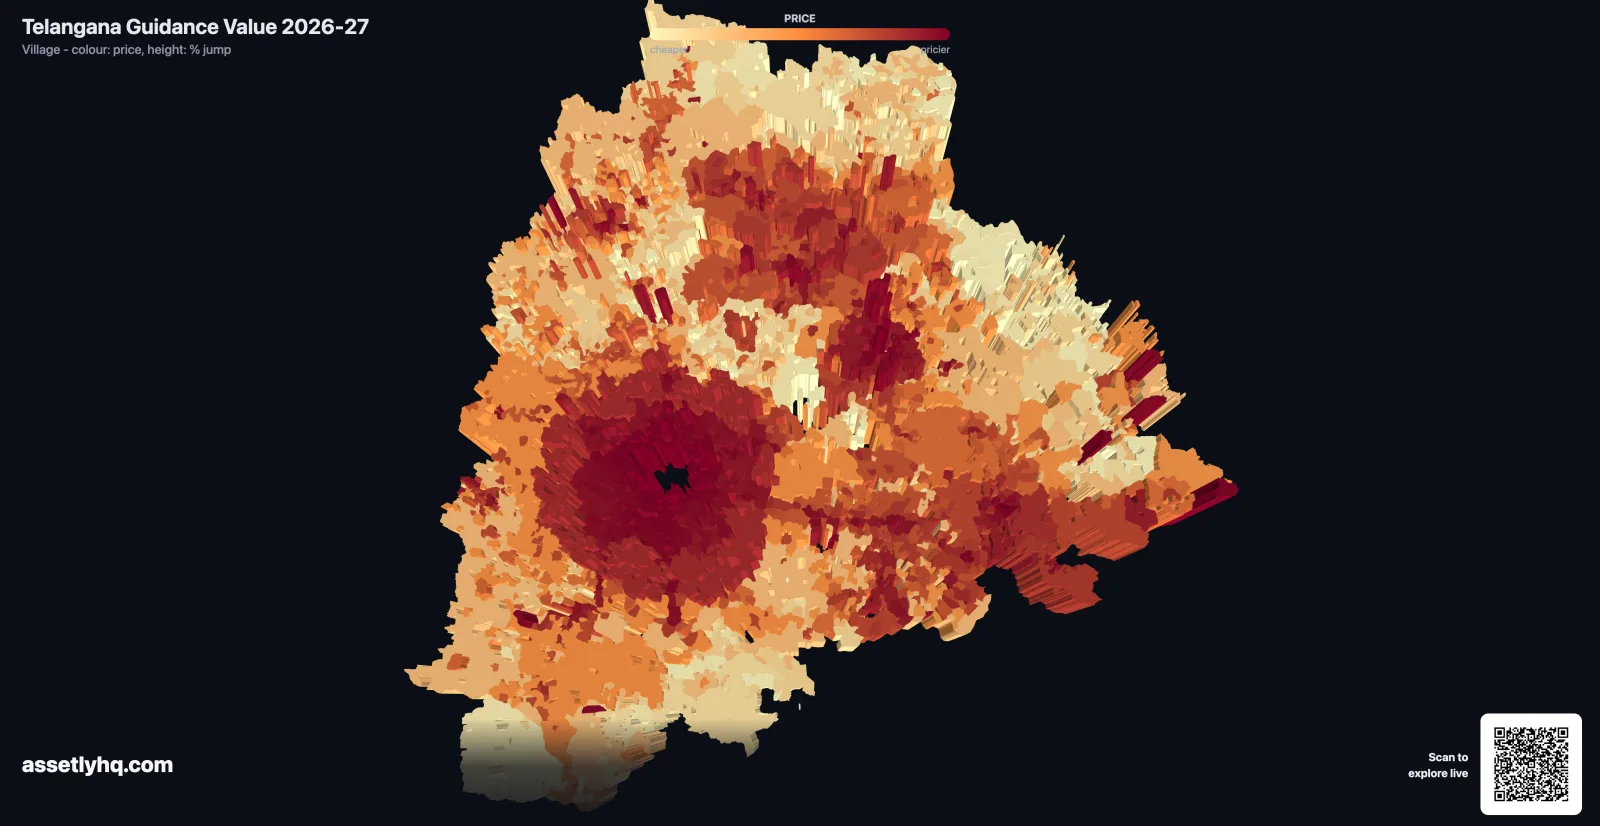
In one revision, the Telangana government re-priced the floor under almost the entire state. Under the Bhu Bharati exercise for FY 2026-27, guidance values - the official market values used to calculate stamp duty and registration charges - were revised across 9,993 villages, 532 mandals, and all 32 districts. The median village rose 75 percent. And about 2,805 villages, 28 percent of the total, at least doubled in value.
If you own land or a plot anywhere in Telangana, this is the number that just changed under your feet. It sets your stamp duty floor on the next sale and shadows your capital gains tax for years. Here is what moved, where it moved most, and what it means for owners.
New to the concept? Guidance value, circle rate, and market value are the same idea under different names. Our pillar guide explains what guidance value is and how the government revises it. This post is the analysis of one specific revision.
How we measured this. We compared the old and new value for the same survey number on both sides of the revision - a direct, like-for-like match across roughly 21 million land records (a 99.5 percent match rate), rather than comparing village averages that can shift for reasons other than price. The figures below cover all of the state’s revenue villages; a thin tail of fast-urbanising villages, where an old farmland rate was replaced by something close to a town rate, produces the steepest multiples.
The Headline: A 75 Percent Median, Unevenly Spread
A median increase of 75 percent is steep, but the word “median” hides how lopsided the revision was. The values did not all rise by the same amount. They fanned out across an enormous range.
Here is how the state’s 9,993 villages distribute by the size of their increase:
| Change in guidance value | Number of villages | Share |
|---|---|---|
| Fell (downward correction) | 3 | 0.0% |
| No change | 29 | 0.3% |
| +1% to +49% | 1,427 | 14.3% |
| +50% to +99% | 5,729 | 57.3% |
| +100% to +199% (at least doubled) | 2,580 | 25.8% |
| +200% or more | 225 | 2.3% |
The bulk of the state - nearly six in ten villages - landed in the 50 to 99 percent band, which is what pulls the median to 75 percent. More than a quarter of villages doubled. Beyond that sits a thin tail: about 225 villages (2.3 percent) jumped by +200 percent or more, almost all of them fast-urbanising pockets where an old agricultural rate was replaced by something close to a town rate, covered further down.
This is the classic shape of a catch-up revision. After years of frozen guidance values, registered prices in the fastest-growing areas had drifted far above the official number, and this single revision pulled the floor up to meet them in one large step rather than a gentle annual climb.
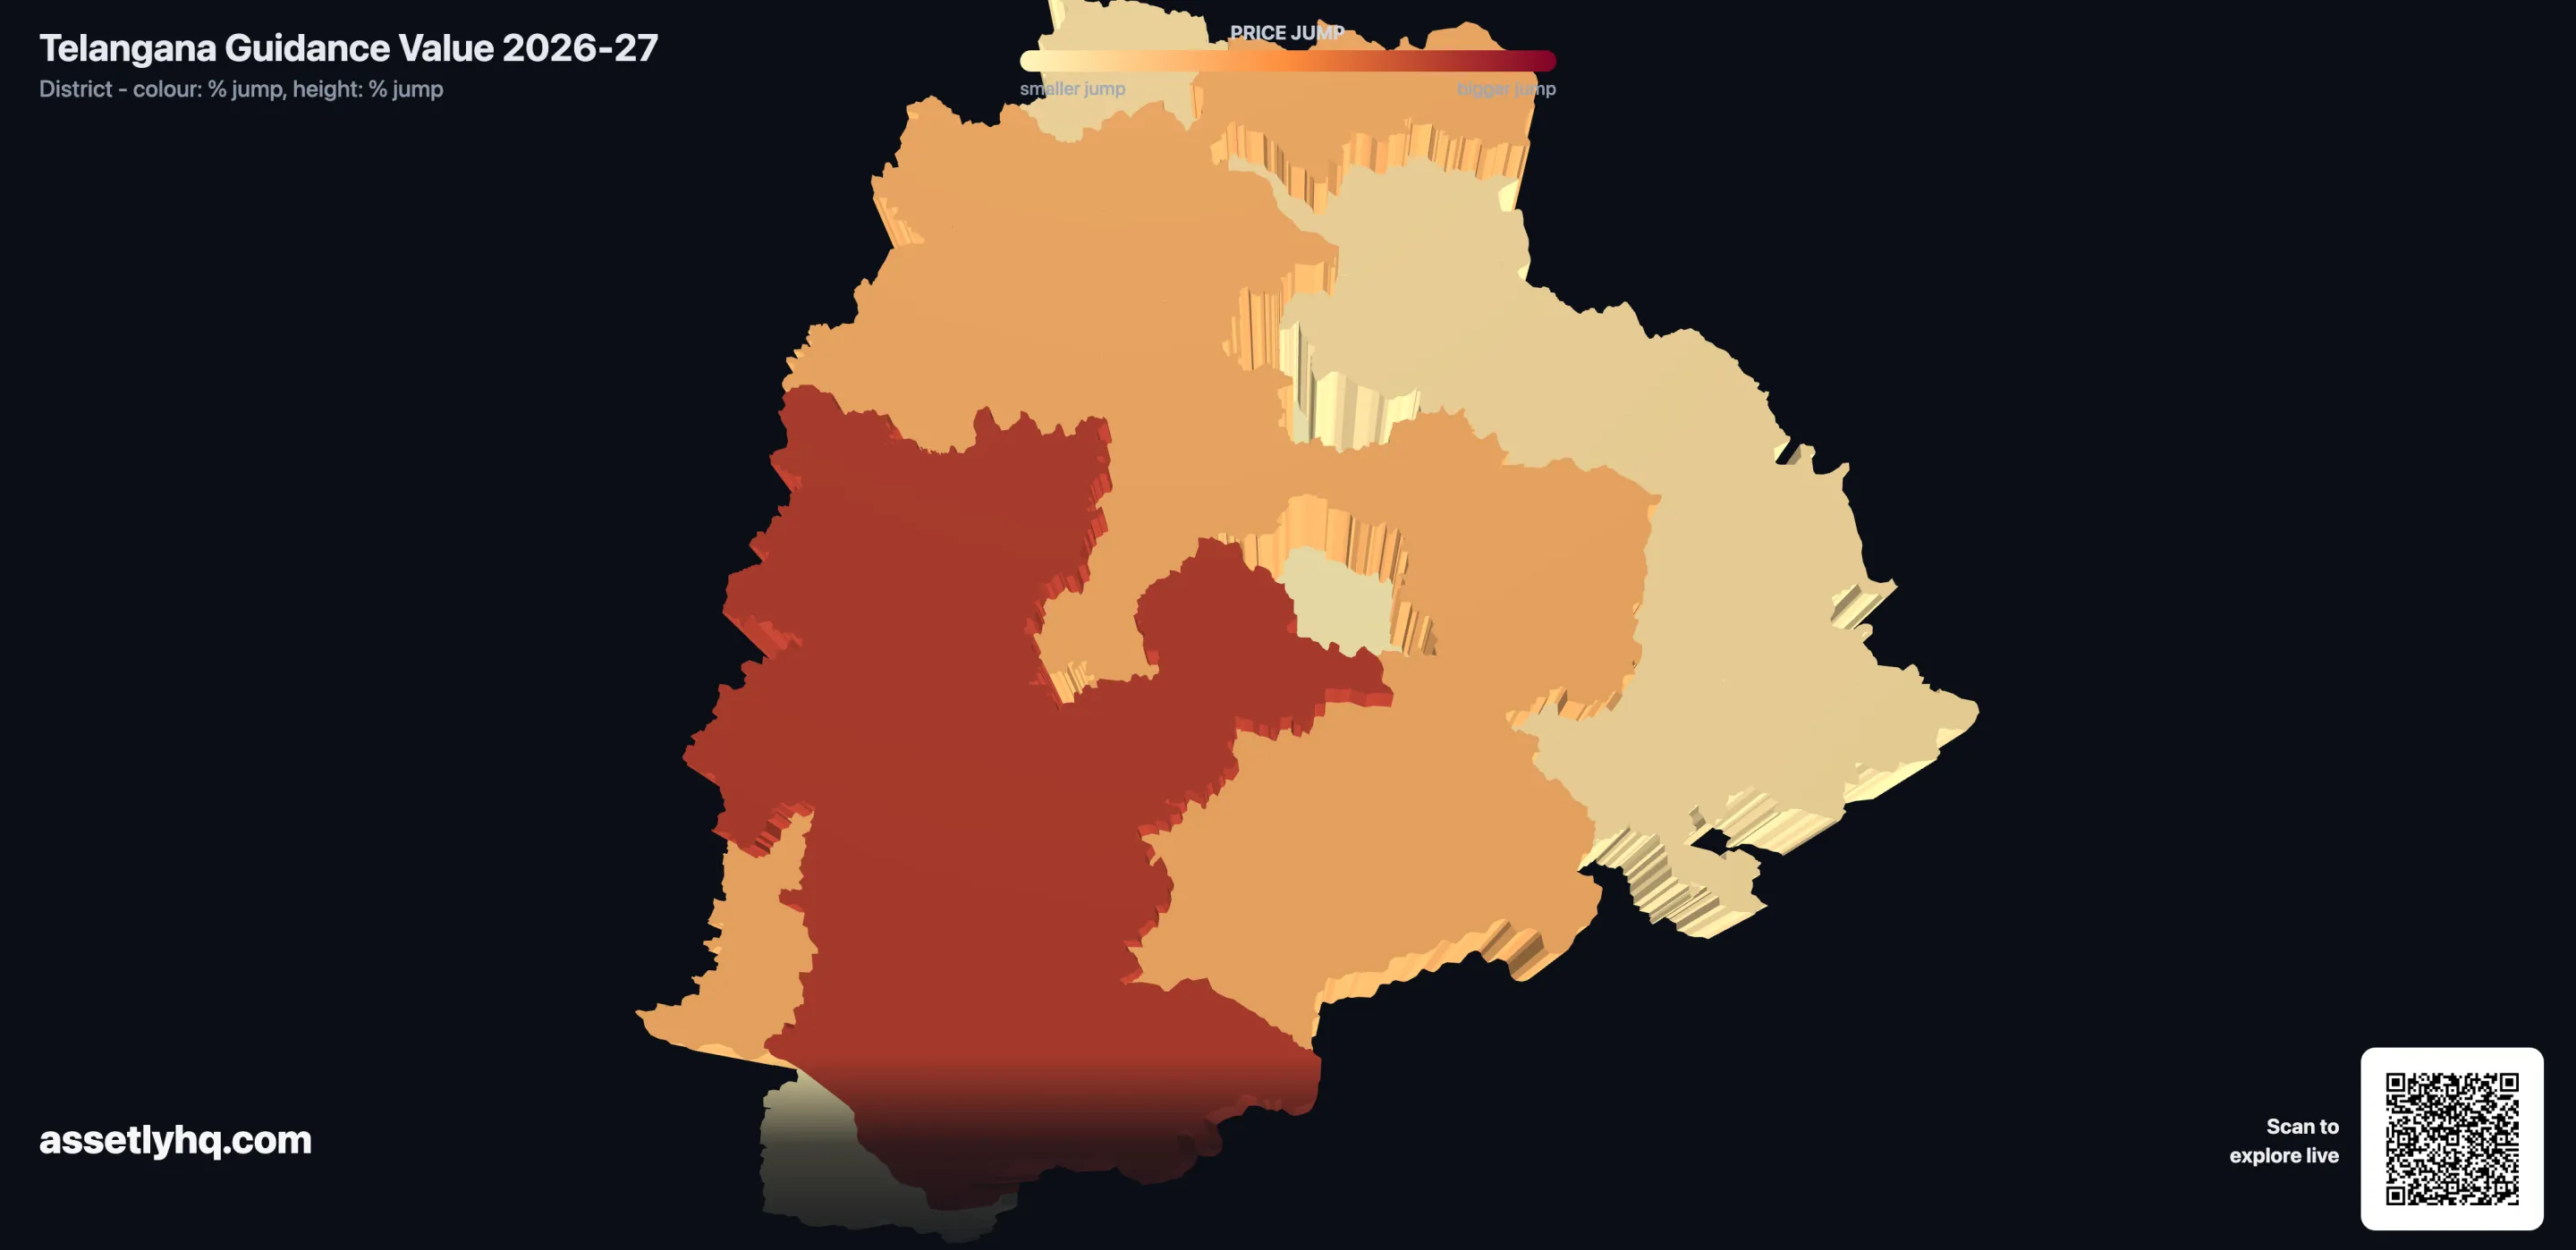
Where Values Doubled: The Biggest-Mover Districts
Seven of Telangana’s 32 districts saw their median village value at least double. These are concentrated on Hyderabad’s growth fringe and across the southern Palamuru belt, where real-estate activity has run well ahead of the old rates.
| District | Median increase | Share of villages that doubled | Villages revised |
|---|---|---|---|
| Sangareddy | +100% | 92% | 577 |
| Wanaparthy | +100% | 83% | 221 |
| Rangareddy | +100% | 76% | 514 |
| Mahabubnagar | +100% | 71% | 289 |
| Vikarabad | +100% | 67% | 488 |
| Yadadri Bhuvanagiri | +100% | 62% | 294 |
| Medak | +100% | 59% | 369 |
Sangareddy stands out: about 92 percent of its villages doubled, the most broad-based jump in the state. It sits directly on Hyderabad’s industrial and residential growth corridor, and the revision essentially confirmed what the market had already priced in. Rangareddy, which wraps around the city’s southern and western edge, and Vikarabad just beyond it tell the same story of the capital’s footprint spreading outward.
The southern Palamuru districts - Mahabubnagar and Wanaparthy - form the second cluster. Helped by improved connectivity and irrigation, registered prices there had quietly climbed, and the revision brought the guidance values up to match. Neighbouring Nagarkurnool sits just below the doubling line, with a +75 percent median.
Below the top seven, most of central and northern Telangana - Nalgonda, Nizamabad, Siddipet, Warangal, and others - clustered around the 75 percent median. A few districts at the periphery, including Karimnagar (+15 percent) and Jogulamba Gadwal (+25 percent), saw far smaller revisions, suggesting their previous values were already close to the market.
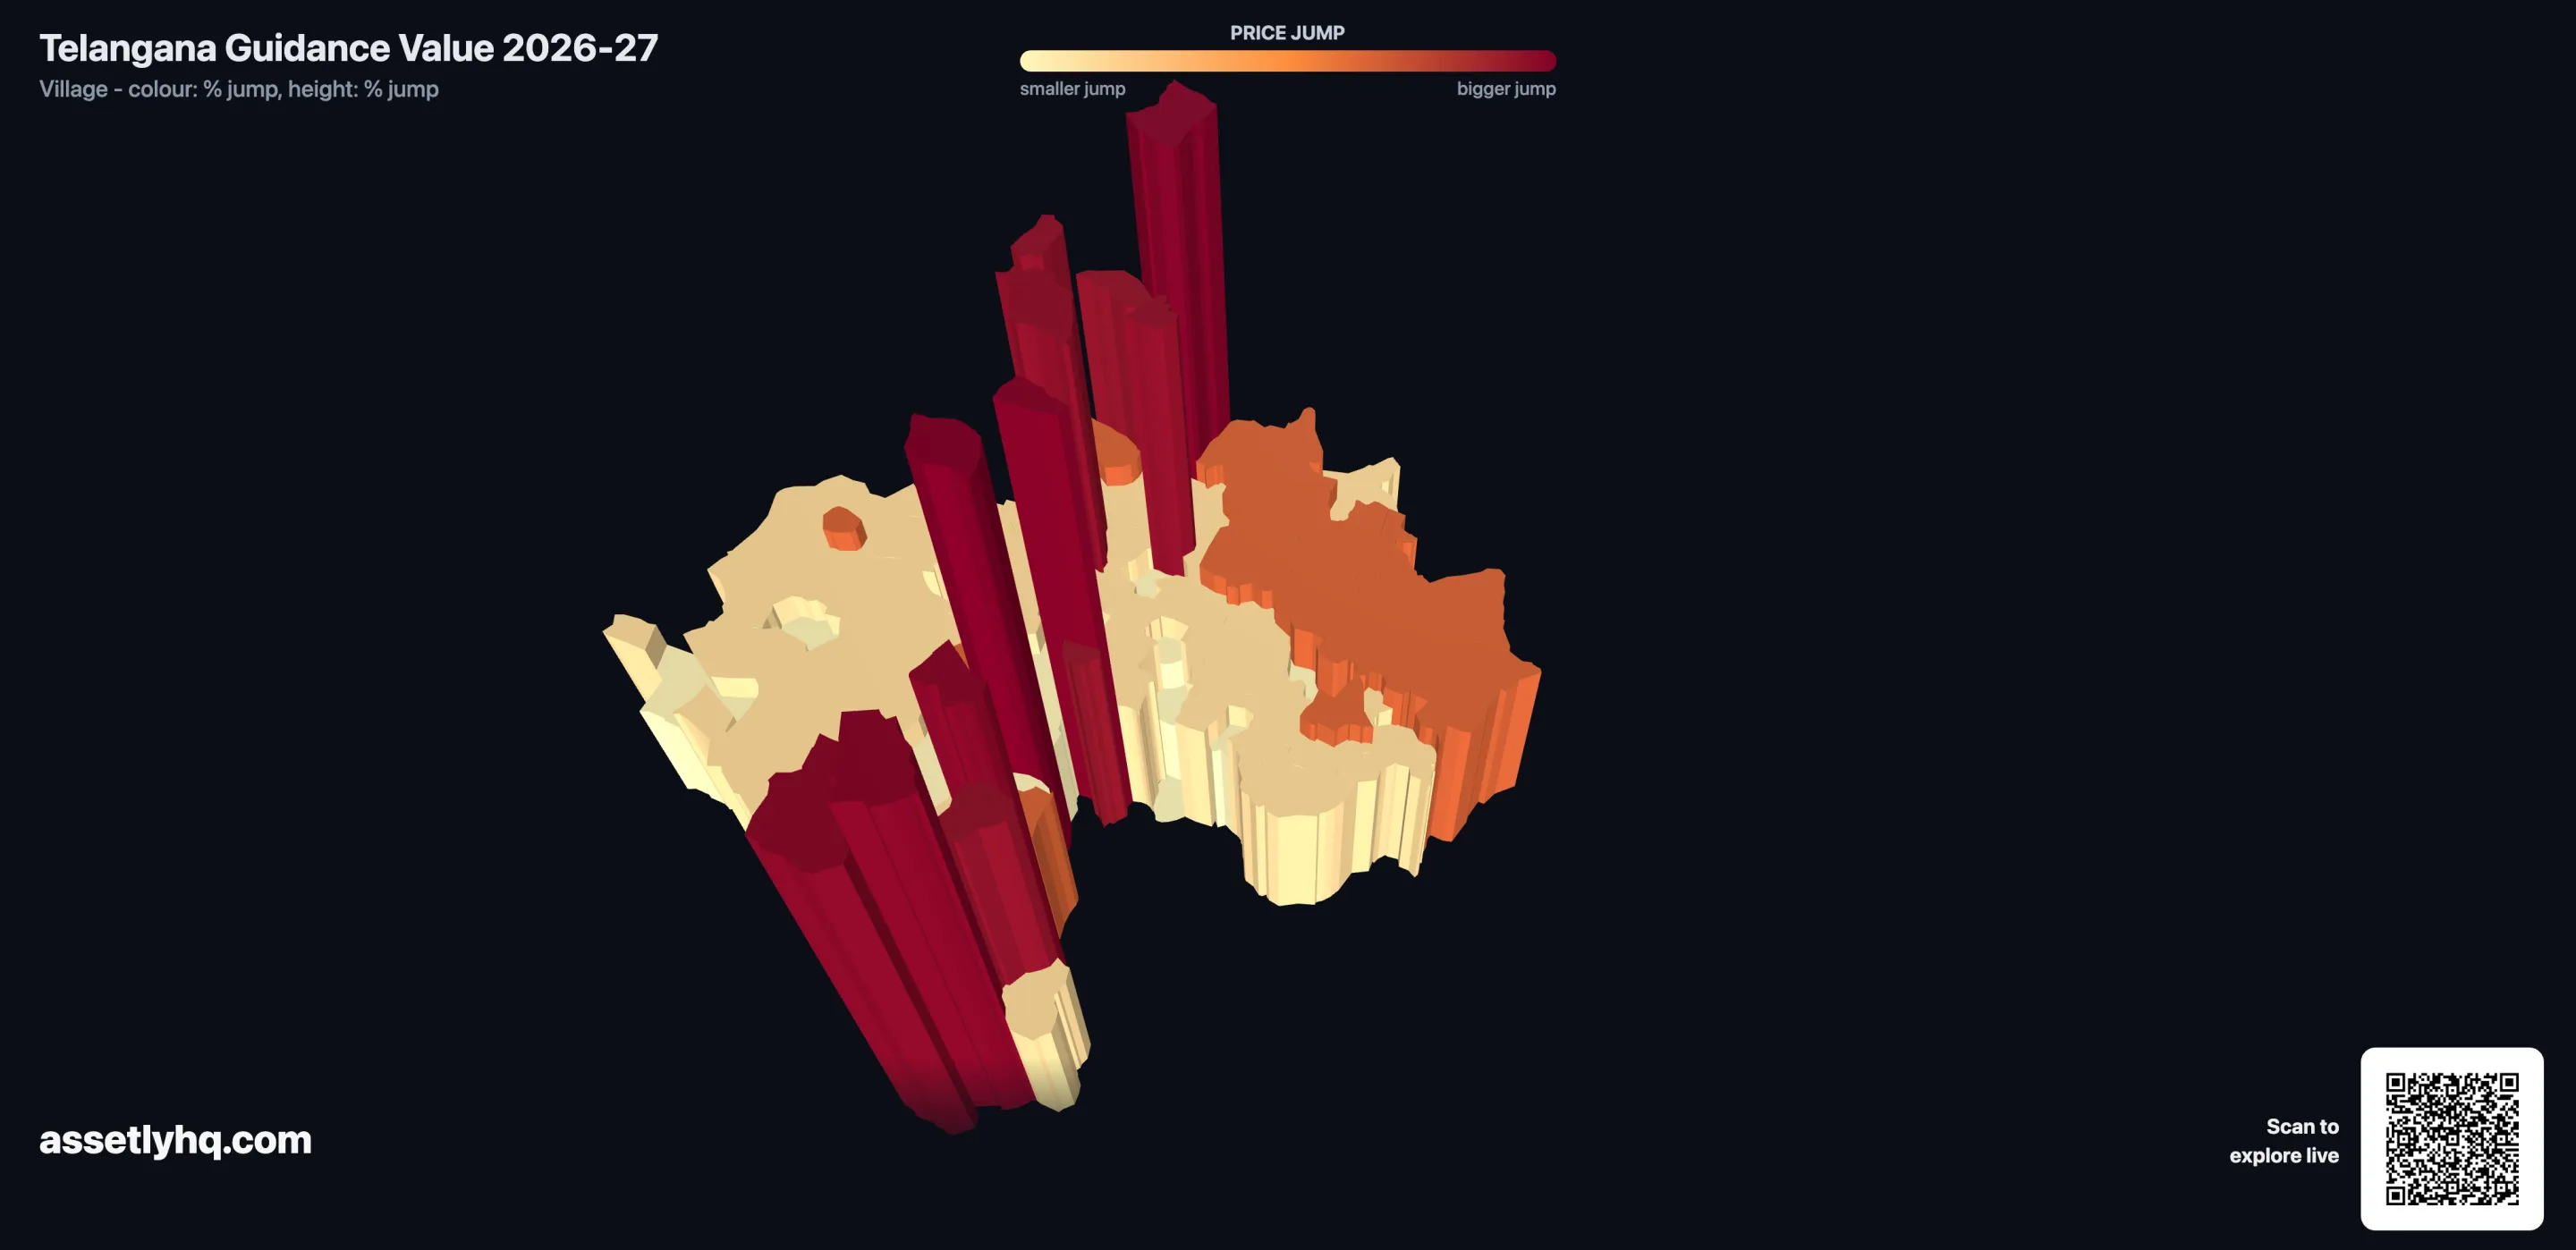
The Sharpest Jumps Are Urbanising Land
The headline figures are about ordinary villages. The sharpest multiples - up to roughly fourteenfold - belong to a different kind of land: pockets on the edge of growing towns that have effectively urbanised, where an old farmland rate was replaced in one step by something close to a town or city rate.
| Village | District | Increase | Old → New (per acre) |
|---|---|---|---|
| Waddepalle | Hanumakonda | +1,305% | Rs 49.0L → Rs 7.7Cr |
| Peddamallareddy | Kamareddy | +1,252% | Rs 2.3L → Rs 30.4L |
| Kotakadira | Mahabubnagar | +1,150% | Rs 1.9L → Rs 23.4L |
| Singaipalle | Wanaparthy | +1,147% | Rs 1.9L → Rs 23.4L |
| Palvelpula | Hanumakonda | +1,093% | Rs 31.9L → Rs 3.8Cr |
Look at Waddepalle and Palvelpula, both in Hanumakonda on the edge of Warangal, the state’s second city. At roughly 7.7 crore and 3.8 crore per acre, those are plainly city plots, not fields. Their old records still carried low agricultural rates, so when the revision applied an urban rate the multiple looks astronomical - but it is really a re-labelling of what the land already was. The same pattern repeats wherever a growing town’s fringe villages were still sitting on a farm rate.
These fast-urbanising pockets are a small minority - the roughly 225 villages above +200 percent - so they sit inside the headline numbers above rather than forming a separate universe. On the explorer map the 3D height is capped at the 98th percentile, so a single soaring village does not flatten the relief of everything around it, while the colour still reflects each village’s true jump. For the overwhelming majority of owners, the story is the more ordinary 50-to-100 percent climb.
Not Everything Went Up
The revision was overwhelmingly upward, but it was not blind. A handful of villages - just three - were corrected downward, because their previous guidance values had been set anomalously high relative to actual transactions.
Every one of them sits on Hyderabad’s western fringe, in Sangareddy and Rangareddy: the sharpest was Chitkul in Sangareddy (about -56 percent), followed by Indresham, also in Sangareddy (about -37 percent), and Maharajpet in Rangareddy (about -11 percent). These are the exceptions that prove the system is, at least occasionally, looking at real data in both directions rather than only ratcheting up - and they are precisely the kind of over-valued pocket that pure urban-fringe speculation can create and then leave behind.
One structural note: the dataset covers the state’s revenue villages, so the fully urban core of Hyderabad district does not appear as agricultural-style village rows. The city’s growth shows up instead through its surrounding districts - Rangareddy and Medchal-Malkajigiri - which is where the registration activity on the urban fringe actually happens.
See Your Own Village on the Map
A table of districts and outliers is a summary. The revision is genuinely local: two villages in the same mandal could have moved very differently. To see exactly how your area changed, the Telangana guidance value explorer renders this entire FY 2026-27 dataset as an interactive 3D map. You can drill from district to mandal to village, colour and raise the map by how much each area jumped, compare the new value against the previous one, and overlay major road corridors to see how connectivity tracks the increases.
It is built on the same data this analysis uses, so the numbers you see on the map are the ones behind every figure above. Find your village, read its old and new value, and you will know your new floor.
What This Means If You Own Property in Telangana
If you are about to buy, your stamp duty and registration cost just went up wherever the guidance value rose, because duty is charged on the higher of the guidance value or your purchase price. In a doubled-value village, the minimum duty floor has doubled too. Budget for it before you commit.
If you are about to sell, the higher guidance value is now your floor. Selling below it triggers deemed-income tax for both you and your buyer under the Income Tax Act, regardless of what you actually receive. If you believe the revised value overstates what your specific plot is worth - plausible in a few of the steepest pockets - do not simply register low; use the formal valuation route. The mechanics of the floor, the tolerance band, and the challenge process are covered in our guide to circle rate, market value, and stamp duty.
If you are holding, there is no immediate cash impact, but your capital gains maths has changed. A higher guidance value today raises the deemed-sale floor whenever you eventually sell. It is worth re-checking any sale you had loosely planned around the old numbers.
If you manage this property from a distance - in another city, or just rarely on site - this is exactly the kind of change that is easy to miss. A revision of this scale can quietly reshape the economics of a planned sale before you notice. Check your village on the explorer, confirm the figure with the Sub-Registrar’s office or the registration portal, and keep your sale deed, encumbrance certificate, and tax records organised so you can recalculate quickly. For the full registration workflow in the state, see our Hyderabad property registration guide.
The Takeaway
Telangana’s FY 2026-27 revision is one of the broadest single-step guidance value changes the state has seen: 9,993 villages re-priced, a 75 percent median jump, and more than a quarter of villages doubled - with the sharpest jumps concentrated in a thin tail of fast-urbanising pockets. For most owners it is not a disaster, but it is a number that quietly changed - and the worst time to discover it is at the registration counter.
Find your village. Read your new floor. Plan around it now, not later.
Assetly helps property owners track ownership, store documents, and stay on top of changes like guidance value revisions.